- Risk Happens Fast
- Is The Selling Over?
- Risk Happens Slowly, Too.
- Sector & Market Analysis
- 401k Plan Manager
Follow Us On: Twitter, Facebook, Linked-In, Sound Cloud, Seeking Alpha

Risk Happens Fast
Over the last few weeks, we’ve been discussing the potential for a correction due to the extreme extension of the market above the 200-dma. To wit:
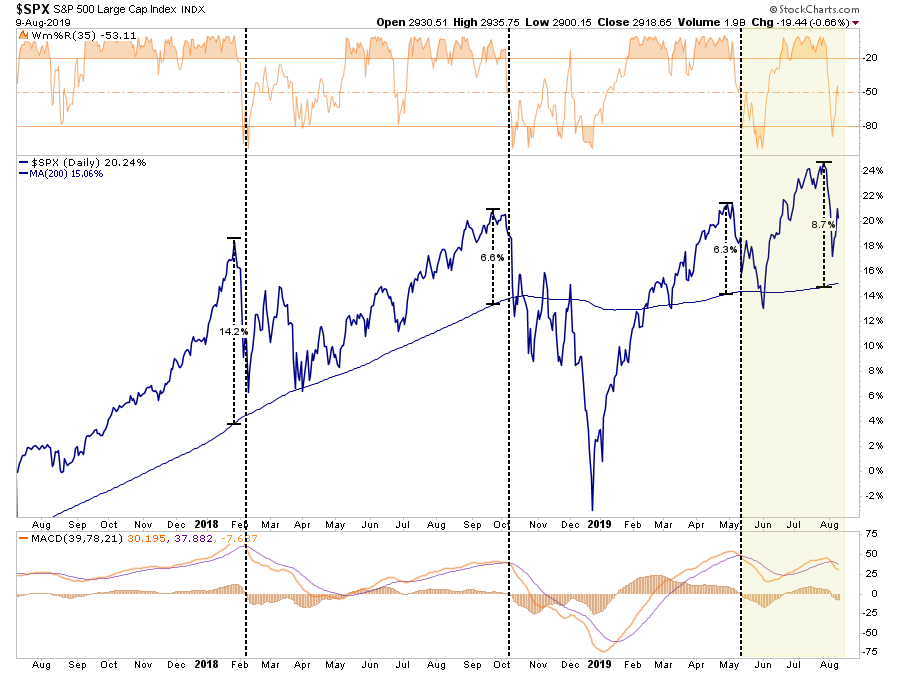
“In the very short-term, the market is grossly extended and in need of some correction action to return the market to a more normal state. As shown below, while the market is on a near-term ‘buy signal’ (lower panel) the overbought condition, and near 9% extension above the 200-dma, suggests a pullback is in order.”
Chart Updated Through Friday
The correction was inevitable; it just needed a catalyst, like President Trump ramping up trade wars, to trip up traders. However, the rebound in the markets through the end of the week was also expected. As we told our RIAPRO subscribers on Monday (30-Day Free Trial).
After 5-days of selling, look for a short-term bounce next week, but we suspect the correction is not complete yet.


We followed that analysis on Tuesday morning before the market opened in “Look for a ‘Sellable Bounce:”
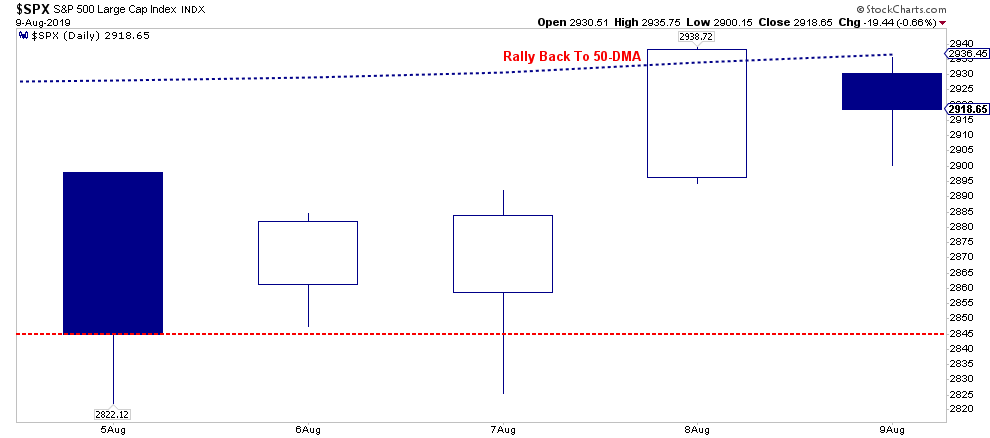
“On a very short-term basis, the market has reversed the previously overbought condition to oversold. This could very well provide a short-term ‘sellable bounce’ in the market back to the 50-dma. As shown in the chart below, any rally should be used to reduce portfolio risk in the short-term as the test of the 200-dma is highly probable.
(We are not ruling out the possibility the market could decline directly to the 200-dma. However, the spike in volatility and surge in negative sentiment suggests a bounce is likely first.)

By the end of the week, the market did indeed retrace back to the 50-dma, but failed to climb above it. With the market only halfway back to “overbought,” there is some “fuel” still available for a further rally next week.
However, even if the market does rally a bit more next week, it is STILL a “sellable rally.”
Therefore, let me restate what actions should be taken in the short-term:
1) Trim Winning Positions back to their original portfolio weightings. (ie. Take profits)
2) Sell Those Positions That Aren’t Working. If they don’t rally with the market during a bounce, they are going to decline more when the market sells off again.
3) Move Trailing Stop Losses Up to new levels.
4) Review Your Portfolio Allocation Relative To Your Risk Tolerance. If you are aggressively weighted in equities at this point of the market cycle, you may want to try and recall how you felt during 2008. Raise cash levels and increase fixed income accordingly to reduce relative market exposure.
This is just the “risk management” process.
Last week, I quoted my friend Victor Adair at Polar Futures Group:
“Risk happens fast.”
In the past, I have spilled much digital ink discussing risk and reward, and possibilities versus probabilities.
Investing is simply about the understanding of risk. However, when risk is compounded by high-speed, automated trading, the effect of “risk” is compressed into a concise time frame. As such, reversions are becoming faster, deeper, and more concentrated than we have seen in the past.
Take a look at the chart below, which shows the daily trading range of the S&P 500.
That’s what is known as “volatility.”
However, volatility has not been just this past week, but for the past four months. While investors may not realize it, the markets are currently no higher than they were at the beginning of May.
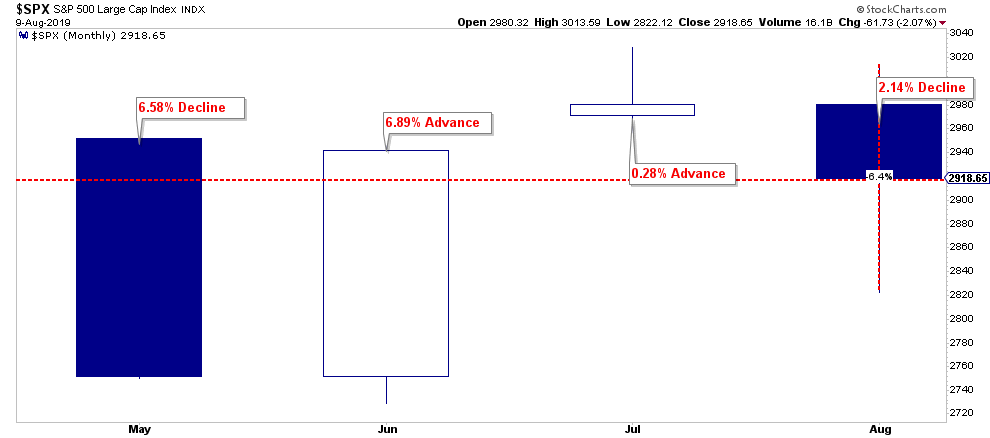
This kind of volatility makes it incredibly tough for investors to sit on their hands and do nothing. But, sometimes, the best course of action is simply “doing nothing.”
However, that depends on what you think will happen next.

Is The Selling Over?
The market, now driven primarily by “headline watching” algorithms, ran up and down this past week on the back of a “tweet.”
Stocks plunged on a tweet that more tariffs would hit China. Then surged on a tweet of a September “trade deal,.” The market then plunged again on a tweet that restrictions would return on Huawei, just to surge again on news the ban would only apply to Federal agencies.
I’m exhausted just typing that.
As I said above, it is difficult to trade kind of volatility.
The good news is the market did rally this past week, as hopes the Fed will continue to cut rates to support asset prices. (I am writing an article for next week on the “Pavlovian effect.”)
The bad news, is the current set up, technically speaking, is much like we saw last September/October as markets. The chart below is the S&P 500 as compared to the “Volatility” index which is inverted for clarity.
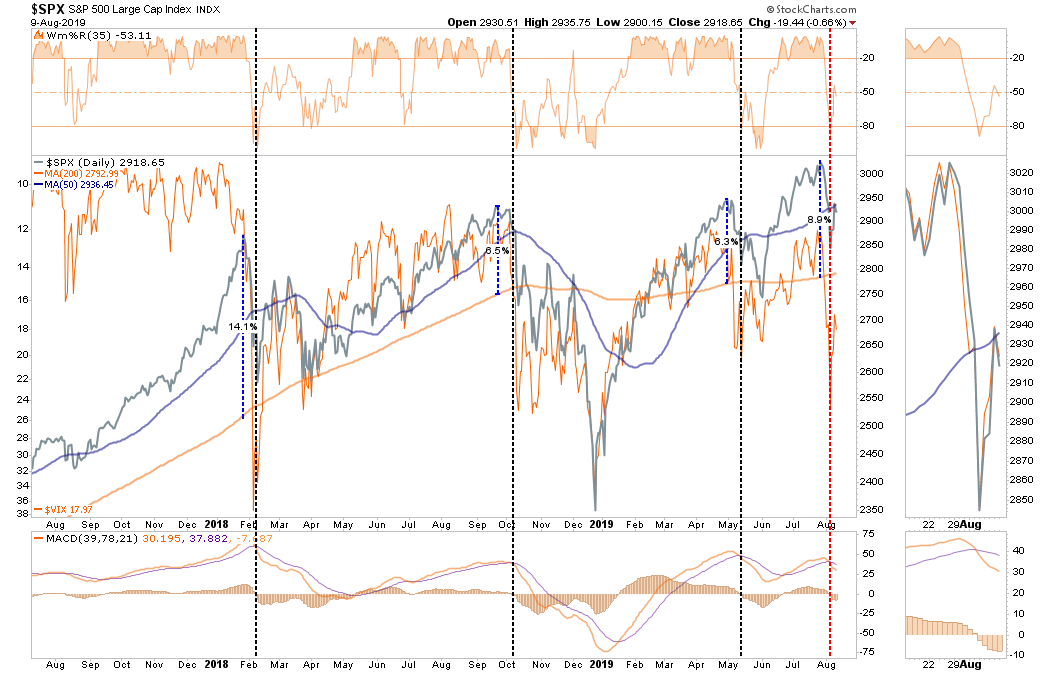
As we saw last year, the market plunged from very overbought conditions, rallied sharply back, and failed again before crashing to lows. The strong contra-rallies pulled investors into the markets before crushing them into the end of the year.
Currently, while it may not be the Fed causing problems for the market, it is the White House that is raising red flags. If the White House follows through on its threats to increase tariffs on China, and assuming that China doesn’t retaliate in return, there is not an inconsequential risk to asset prices as markets begin to reprice earnings. (More on this in a moment)
Importantly, the market has triggered a “sell signal” much like was seen in both May of this year, and in February and October of 2018.
Given that we took profits in May and July from portfolios, raised cash, and are carrying hedges, we will “sit on our hands” for the moment and wait for the market to “tell us” what it wants to do next.
However, our signals suggest the risk, at the moment, is to the downside.

Risk Happens Slowly Too
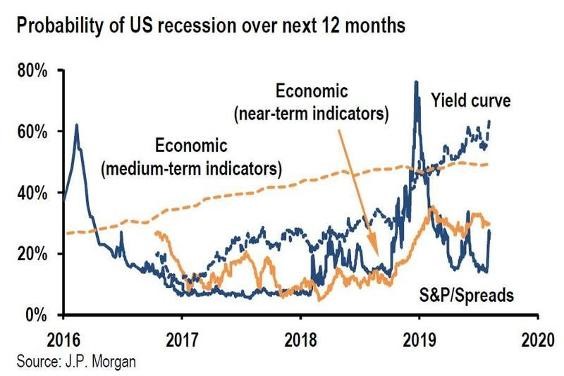
While “risk happens fast” in the financial markets, it builds up slowly as well. As Doug Kass noted this past week:
“The odds of a U.S. recession according to JP Morgan is 40% – a cycle high. The rate of growth is slowing measurably. The manufacturing recession is now seeping into the consumer sector.”
“Like in 2007, (though the circumstances are far different) many investors, and even Administration officials, are ignoring the tea leaves of substantially slowing global economic growth.
With the world more interconnected at any time in history, non-domestic economic activity is importantly influencing the S&P Index’s constituent companies’ top- and bottom- lines.”
He is absolutely correct.
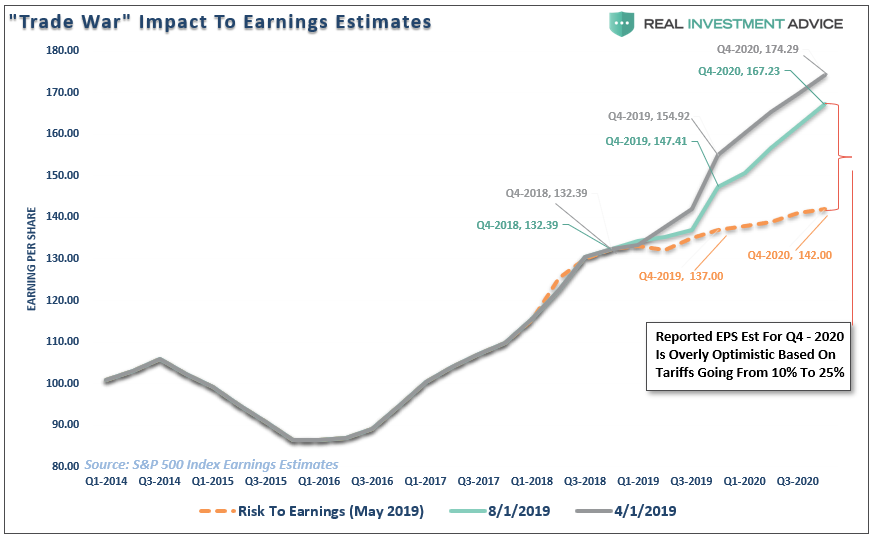
Most importantly, while investors are betting on more Fed rate cuts, they are missing what is happening with earnings which continue to erode. The first chart is our earnings estimates (which we projected in June, 2018, unrevised for accountability) versus S&P’s estimates (which are constantly revised.) Note that estimates not only caught up with our original projections (wiping out the entire benefit of tax cuts) but has now exceed those levels.
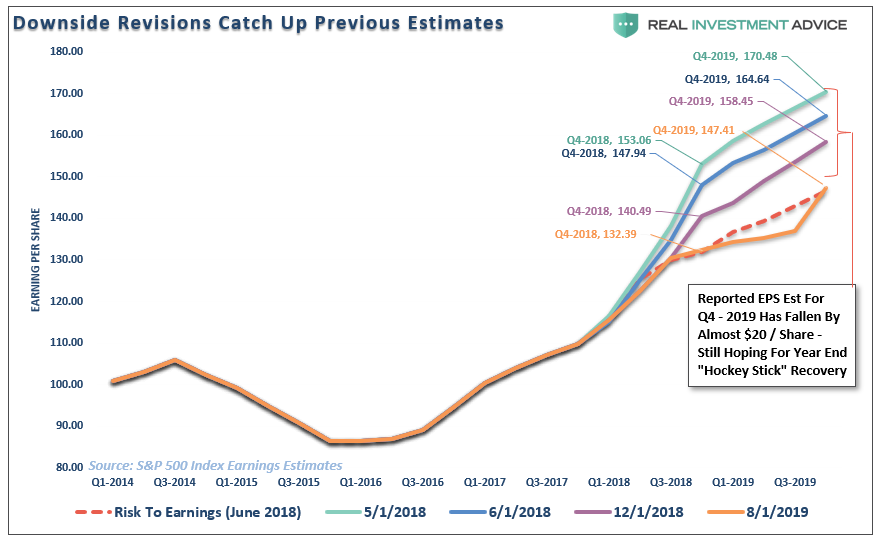
Despite the collapse in earnings, stocks are currently trading higher than they were in then. Valuations have expanded by 3x, while earnings have deteriorated. More importantly, and even less optimistic for the bulls, is the continued deterioration of 2020 estimates. (The orange dashed line is our estimate for earnings based on assumptions of trade war impacts.)
This is not a problem the Fed cutting rates, or doing QE, will fix.
The other problem for the bullish view is the global glut.
Following the financial crisis, it was China’s consumption binge which bailed out the majority of the world. While many believe it was Central Banks that rescued the globe, it really wasn’t.
However, now, China is at its limits, and the global glut and output gap has now come home to roost.
Doug drives this point home:
“An output gap is the difference between actual global GDP and the level that would be consistent with operating at full capacity. The difference today is a consequential 0.5% – an unusually large figure considering the late stage cycle of economic growth.
In other words, a subpar economic recovery since The Great Recession has yielded excess global supply. This idle capacity has been accompanied with a continuous deflationary influence that has contributed to generational lows in worldwide interest rates and a central bank community that is quickly out of monetary bullets.
This means that since 2007, the $128 trillion of new global debt has been supported by only $27 trillion of new income. (Debt has grown by a factor of 5x against the amount of money that can support it!)
World debt is now about 295% of world GDP – a new record.
To understand the severity of this problem we should look back into the 2001-07 cycle. During that period global debt rose by only $30 trillion (from $86 trillion to $116 trillion). In the interim interval, global GDP rose by $25 trillion to $58 trillion. So, in the bubble cycle of 2001-07, debt growth (+$30 trillion) outstripped economic growth (+$25 trillion) by only 20% compared to the 2007-19 time frame in which debt growth (+$128 trillion) outstripped economic growth (+$37 trillion) by nearly 400%!!!
Ignore the massive buildup of global debt (against the backdrop of slow global nominal GDP) at your own risk.”
While investors are hoping that Fed rate cuts and QE will extend the current cycle, I can’t stress enough that when the recession hits, and it will, it will be a far more destructive process than the current consensus believes.
It will be the “Perfect Storm” when debt, demographics, and unfunded pension obligations collide. There is simply not enough money to bail it all out at once.
If you need help or have questions, we are always glad to help. Just email me.
See you next week.
Market & Sector Analysis
Data Analysis Of The Market & Sectors For Traders

If you are NOT an RIA PRO subscriber you are missing the most important part of each weeks’ newsletter.
- Sector & Market Performance Analysis
- Portfolio Recommendations
- What We Are Doing With Our Clients.
Try it today for FREE for 30-days.
THE REAL 401k PLAN MANAGER
A Conservative Strategy For Long-Term Investors
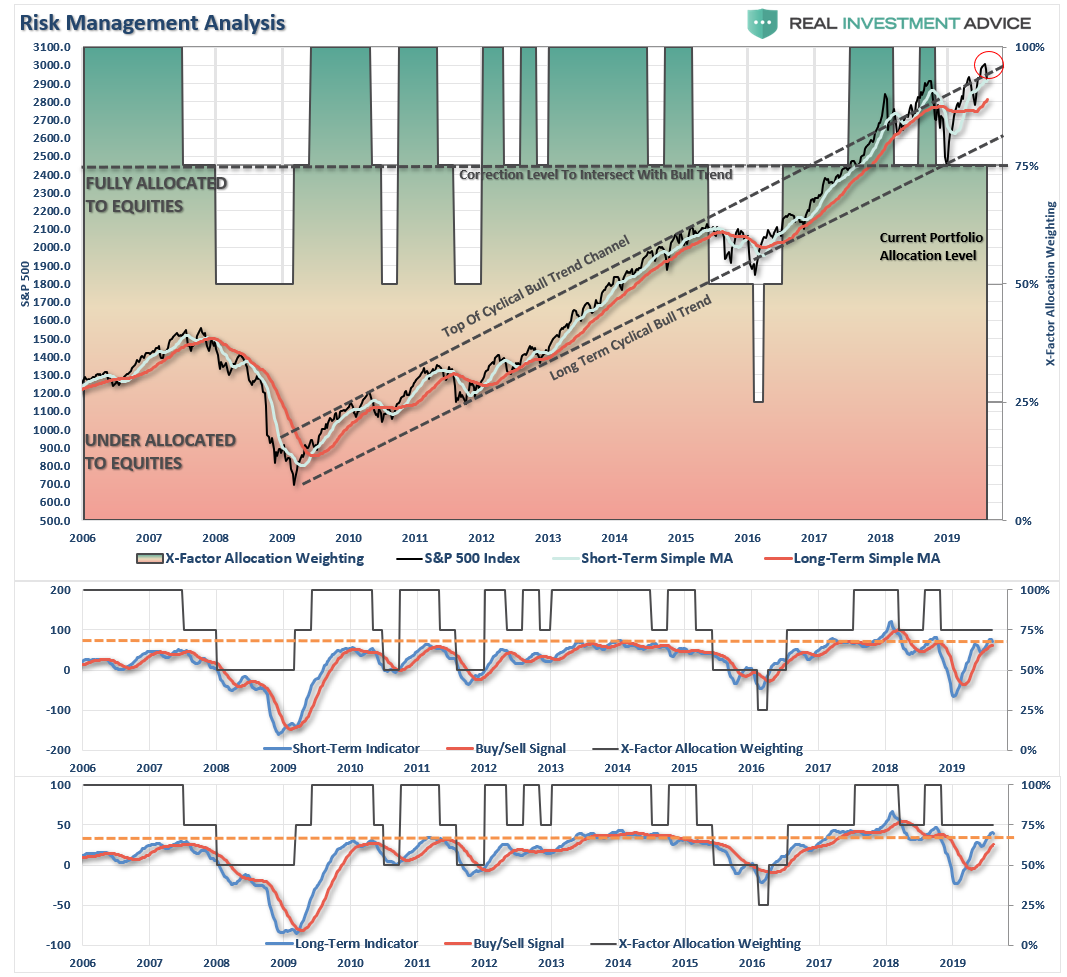
There are 4-steps to allocation changes based on 25% reduction increments. As noted in the chart above a 100% allocation level is equal to 60% stocks. I never advocate being 100% out of the market as it is far too difficult to reverse course when the market changes from a negative to a positive trend. Emotions keep us from taking the correct action.

Trump Is Making This Really Tough
As I wrote last week:
“A less than anticipated rate cut, and outlook, by the Fed tripped up participants. Then Trump deciding to add additional tariffs on China, in order to force the Fed to cut rates, roiled stocks even more. Stocks sold off for the entirety of last week, so expect a rally early next week to sell into. Take some actions if you have not already as the next two months could bumpy. The correction is likely not complete yet.
More tweets and volatility this week, however, stocks did rise from their lows as anticipated. However, like I wrote last week, we are not likely done with the correction yet. Take some actions in your plans on Monday as needed to minimize risk for now.
- If you are overweight equities – Hold current positions but remain aware of the risk. Take some profits and rebalance risk to some degree if you have not already.
- If you are underweight equities or at target – rebalance risks, look to increase holdings in domestic equities opportunistically if the markets can hold support at the May highs next week.
We will remain patient again this week.
If you need help after reading the alert; do not hesitate to contact me.
401k Plan Manager Beta Is Live
We have rolled out a very early beta launch to our RIA PRO subscribers
Be part of our “Break It Early Testing Associate” group by using CODE: 401
The code will give you access to the entire site during the BETA testing process, so not only will you get to help us work out the bugs on the 401k plan manager, you can submit your comments about the rest of the site as well.
We have several things currently in development we will be adding to the manager, but we need to start finding the “bugs” in the plan so far.
We are currently covering more than 10,000 mutual funds and have now added all of our Equity and ETF coverage as well. You will be able to compare your portfolio to our live model, see changes live, receive live alerts to model changes, and much more.
We are building models specific to company plans. So, if you would like to see your company plan included specifically, send me the following:
- Name of the company
- Plan Sponsor
- A print out of your plan choices. (Fund Symbol and Fund Name)
I have gotten quite a few plans, so keep sending them and I will include as many as we can.
If you would like to offer our service to your employees at a deeply discounted corporate rate, please contact me.
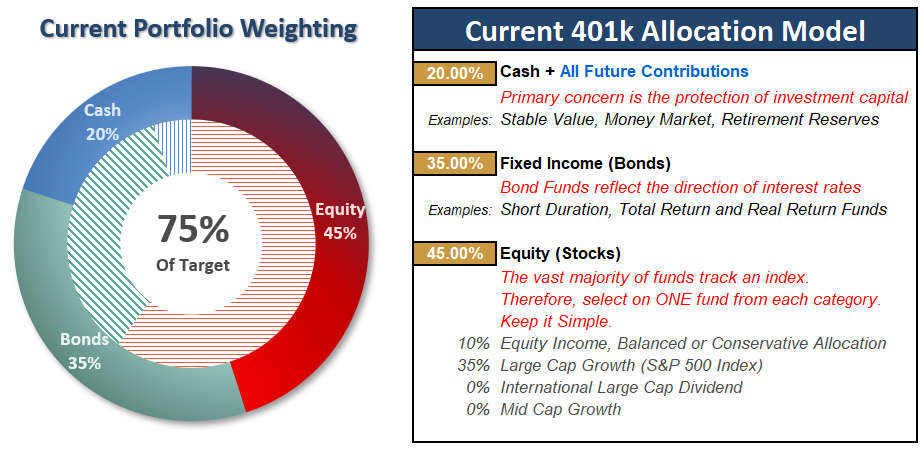
Current 401-k Allocation Model
The 401k plan allocation plan below follows the K.I.S.S. principle. By keeping the allocation extremely simplified it allows for better control of the allocation and a closer tracking to the benchmark objective over time. (If you want to make it more complicated you can, however, statistics show that simply adding more funds does not increase performance to any great degree.)
Model performance is based on a two-asset model of stocks and bonds relative to the weighting changes made each week in the newsletter. This is strictly for informational and educational purposes only and should not be relied upon for any reason. Past performance is not a guarantee of future results. Use at your own risk and peril.